DATA ANALYSIS INTRODUCTION

Step into the realm of data-driven decision-making with our industrial engineers’ expertise in data analysis.

Through cutting-edge analytics, we uncover actionable insights that drive strategic decision-making and operational excellence. We delve into how to leverage data and optimize processes, boost efficiency, and drive innovation across industries. Explore how our analytical prowess can transform your business landscape.

What is the purpose of Data Analysis in Industrial Engineering?

Performance Management, allows businesses to track performance on tasks to Time Standards. Data Analysis forms the ba
Time Standards, drives the creation of Time Standards within an organization, if they choose to use Time Estimates.
Continuous Improvement, the foundation for six-sigma and lean improvement opportunities. Learn more about Six-Sigma and Data Analysis.

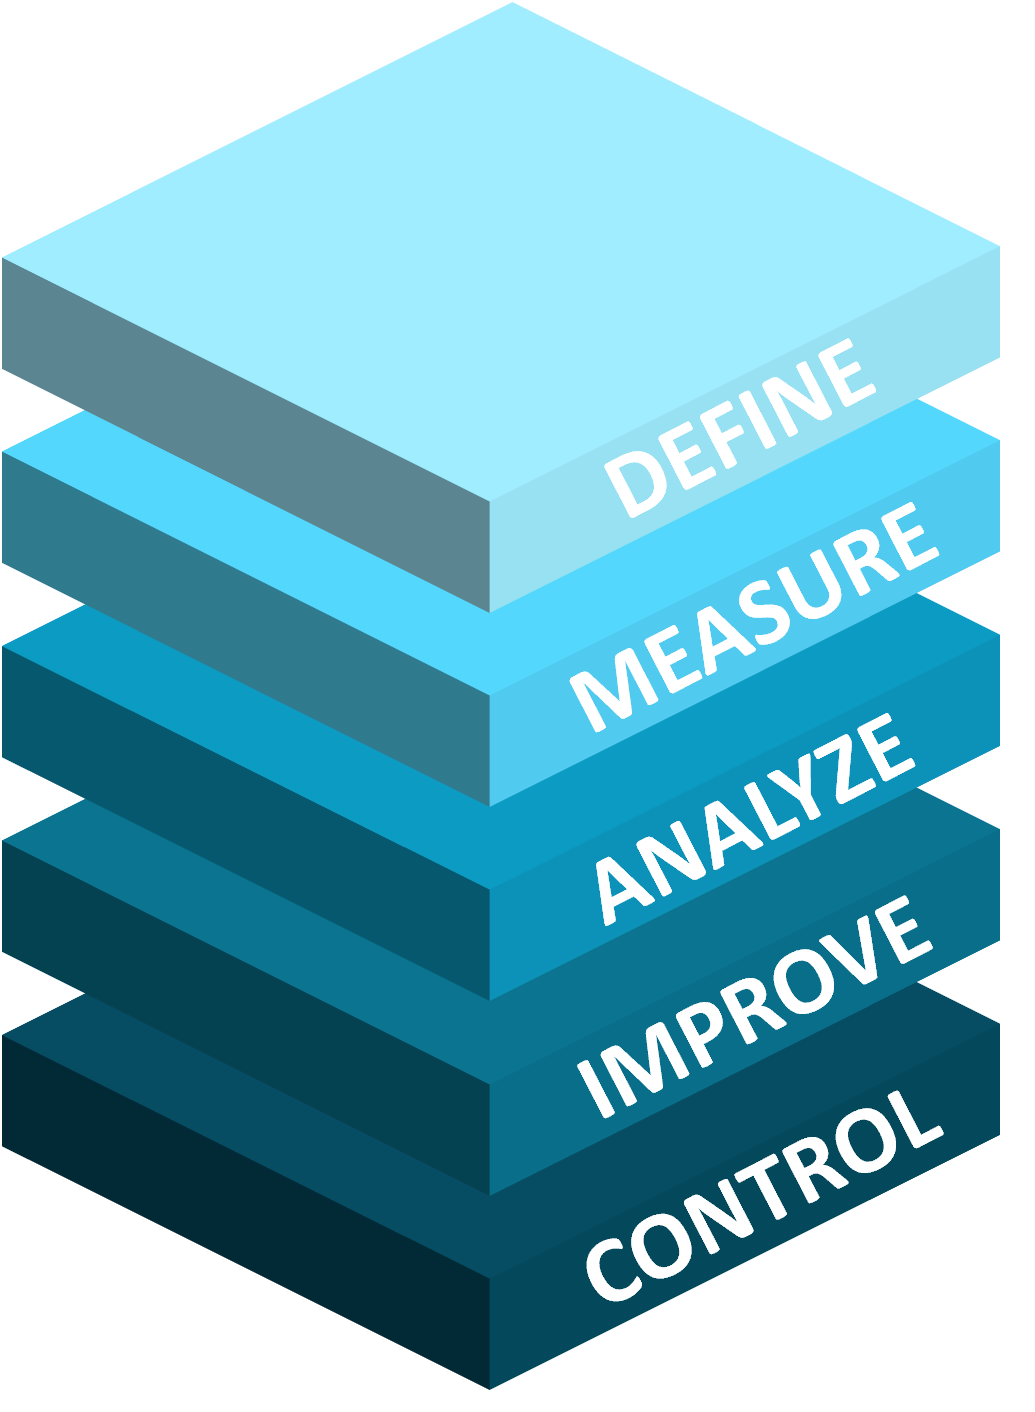
BUILDING BLOCKS OF SIX SIGMA AND LEAN

Six Sigma Data Analysis

WHAT IS SIX SIGMA?

A powerful methodology for improving processes and reducing defects. Rooted in data-driven decision-making, Six Sigma aims to minimize variation and optimize performance to achieve near-perfect outcomes. Join us as we explore the principles and techniques of Six Sigma to drive excellence and efficiency in your organization.

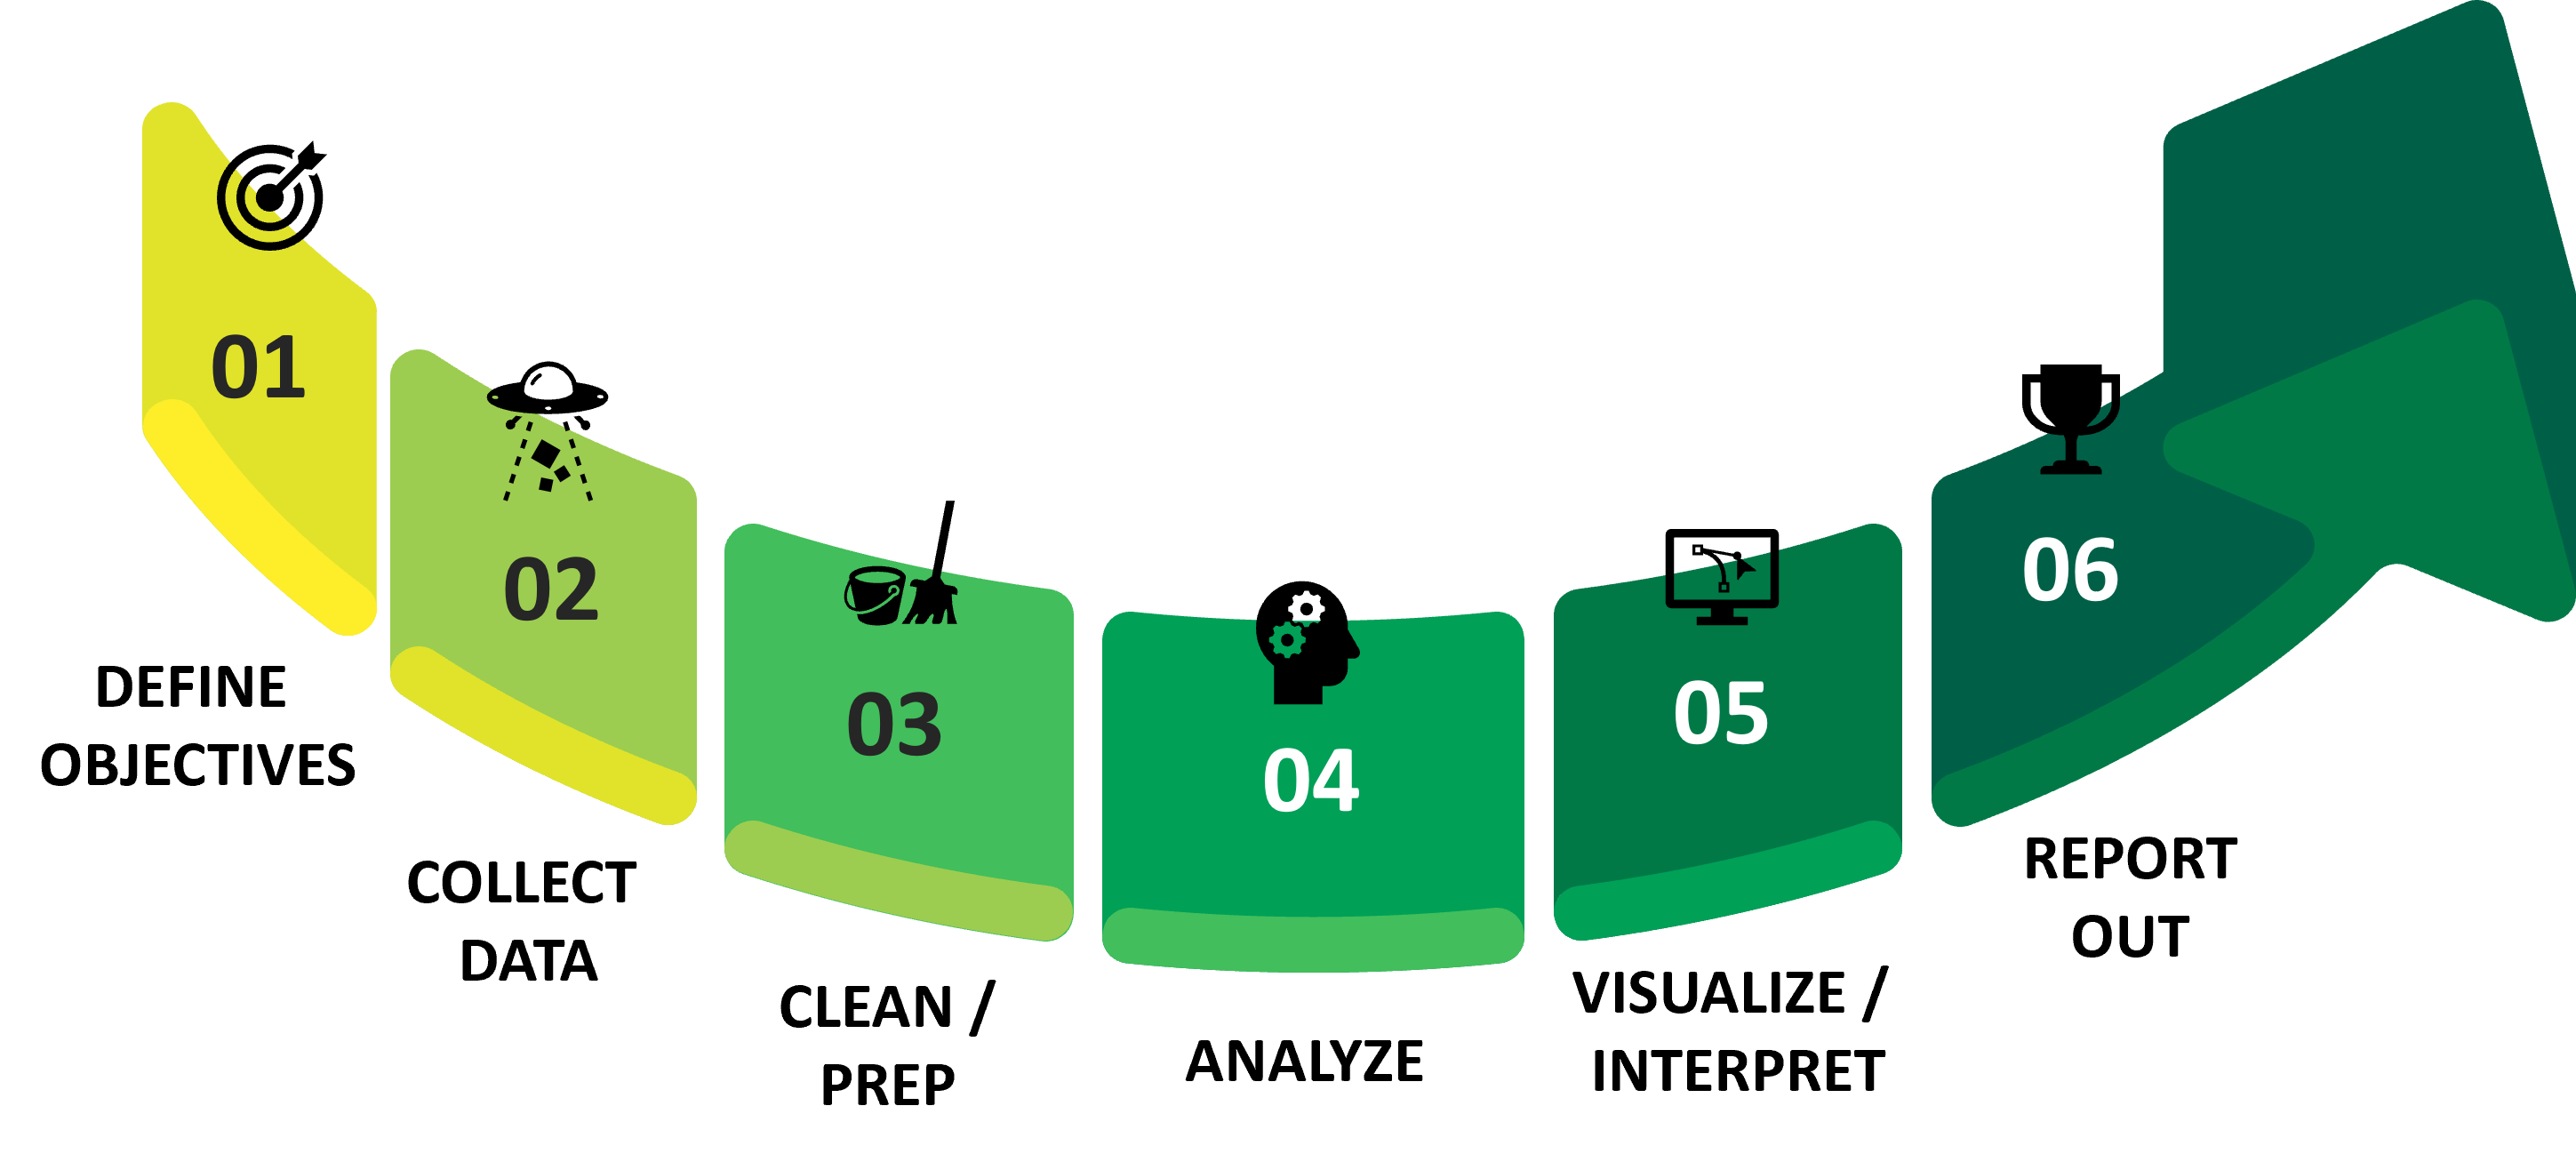
HOW TO PERFORM DATA ANALYSIS?
What are the Methods / Programs?

Microsoft Excel is a tool for organizing, manipulating, visualizing, and analyzing data via spreadsheets, with functions, formulas, and charting options.

MySQL is a database management system for storing, querying large datasets, supporting complex data analysis through SQL (Structured Query Language).

Microsoft Access is a user-friendly database system, able to streamline storage, retrieval, and analysis through customizable forms, queries, and reports.

Tableau is a data visualization tool for creating interactive, shareable dashboards that turn raw data into insights.

Minitab is a statistical software that simplifies analysis, quality improvement, and visualization through user-friendly tools.

PRO vs CON

Overview of Data Programs

PRO’s

EXCEL
User-Friendly Interface – accessible and intuitive, making it easy for users of varying skill levels to perform basic data analysis tasks.
Versatility – wide range of functionalities, from basic calculations to complex data manipulation and visualization, making it suitable for diverse analytical needs.
TABLEAU
Powerful Visualization Capabilities – robust tools for creating interactive and visually appealing dashboards, allowing users to easily explore and communicate insights from their data.
Data Integration – integrates with a wide range of data sources, including databases, spreadsheets, and cloud services, enabling users to analyze data from multiple sources in one platform.
MINITAB
Specialized Statistical Analysis – offers a wide range of advanced statistical tools and methods, making it particularly suitable for in-depth statistical analysis and quality improvement projects.
Quality Improvement Tools – provides specialized features for Six Sigma and quality improvement initiatives, including process capability analysis, design of experiments (DOE), and control charts, empowering organizations to drive continuous improvement.

CON’s

EXCEL
Lack of Advanced Analytical Features – limitations in handling large datasets, which can lead to performance issues and hinder complex analysis tasks.
Limited Data Handling Capacity – lacks sophisticated statistical and predictive analysis capabilities required for advanced analysis tasks.
TABLEAU
Steep Learning Curve – advanced features and functionalities may require significant time and effort to master, especially for users with limited experience in data visualization and analysis.
Limited Data Manipulation – capabilities for data manipulation and transformation are relatively basic compared to dedicated data preparation tools, requiring users to perform data cleaning tasks outside of Tableau.
MINITAB
Limited Data Visualization – visualization capabilities are relatively basic compared to other analysis tools, limiting its ability to create complex and interactive visualizations.
Dependency on Statistical Knowledge – user-friendly, but leveraging its full potential often requires a solid understanding of statistical concepts and methodologies, which may pose a challenge for users with limited statistical expertise.