SIX SIGMA INTRODUCTION
Six Sigma is a methodology used to improve business processes by reducing defects and variations, thereby enhancing quality and efficiency. Developed by Motorola in the 1980s and popularized by companies like Toyota, Six Sigma aims to achieve near-perfect results, with a goal of no more than 3.4 defects per million opportunities.
Central to the Six Sigma approach is data analysis, which involves collecting, analyzing, and interpreting data to make informed decisions.
WHAT IS SIX SIGMA?
Six Sigma’s integration of data analysis and statistical tools provides a robust framework for continuous improvement. The core of Six Sigma is the DMAIC process, which stands for:
Define: Identify the problem and project goals.
Measure: Collect data and determine current performance.
Analyze: Investigate the data to identify root causes of defects.
Improve: Implement solutions to address root causes.
Control: Monitor the improvements to ensure sustained success.

KEY STATISTICAL TOOLS
Several statistical tools are used in Six Sigma for data analysis. Some common ones include:
DESCRIPTIVE STATISTICS
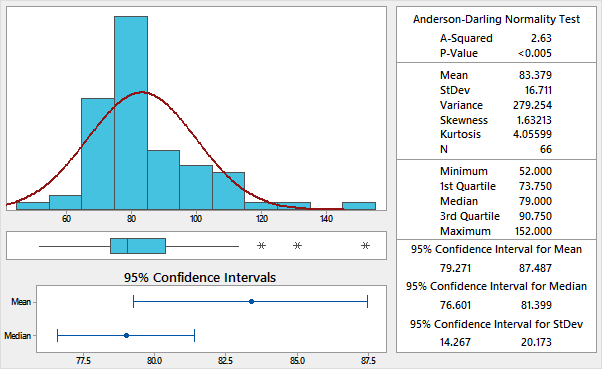
These tools summarize data, providing insights into central tendencies (mean, median, mode), variability (range, standard deviation, variance), and data distribution.

PROCESS CAPABILITY ANALYSIS
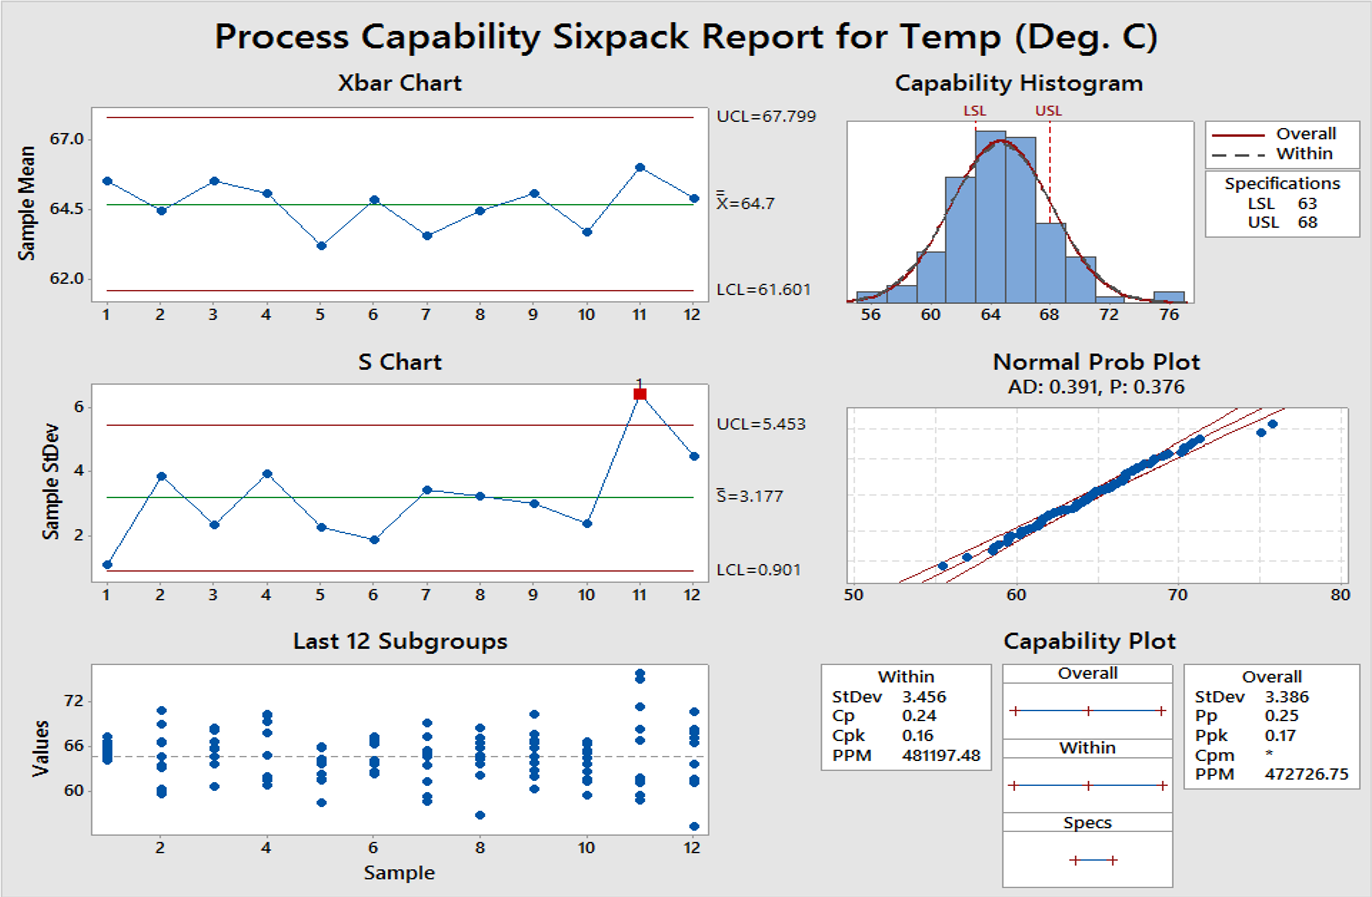
Capability Analysis quantifies process variability relative to the tolerance limits and provides insights into the capability of the process to produce output within acceptable quality levels. It often utilizes S and X-bar charts, histograms, PPK, CPK and other tools to monitor process stability and identify areas for improvement, ensuring consistent quality output.

ANOVA (ANALYSIS OF VARIANCE)
Determines whether there are statistically significant differences between the means of various groups. ANOVA assesses whether the variability between group means is greater than the variability within groups, helping researchers identify which factors have a significant effect on the outcome variable.
PARETO CHART
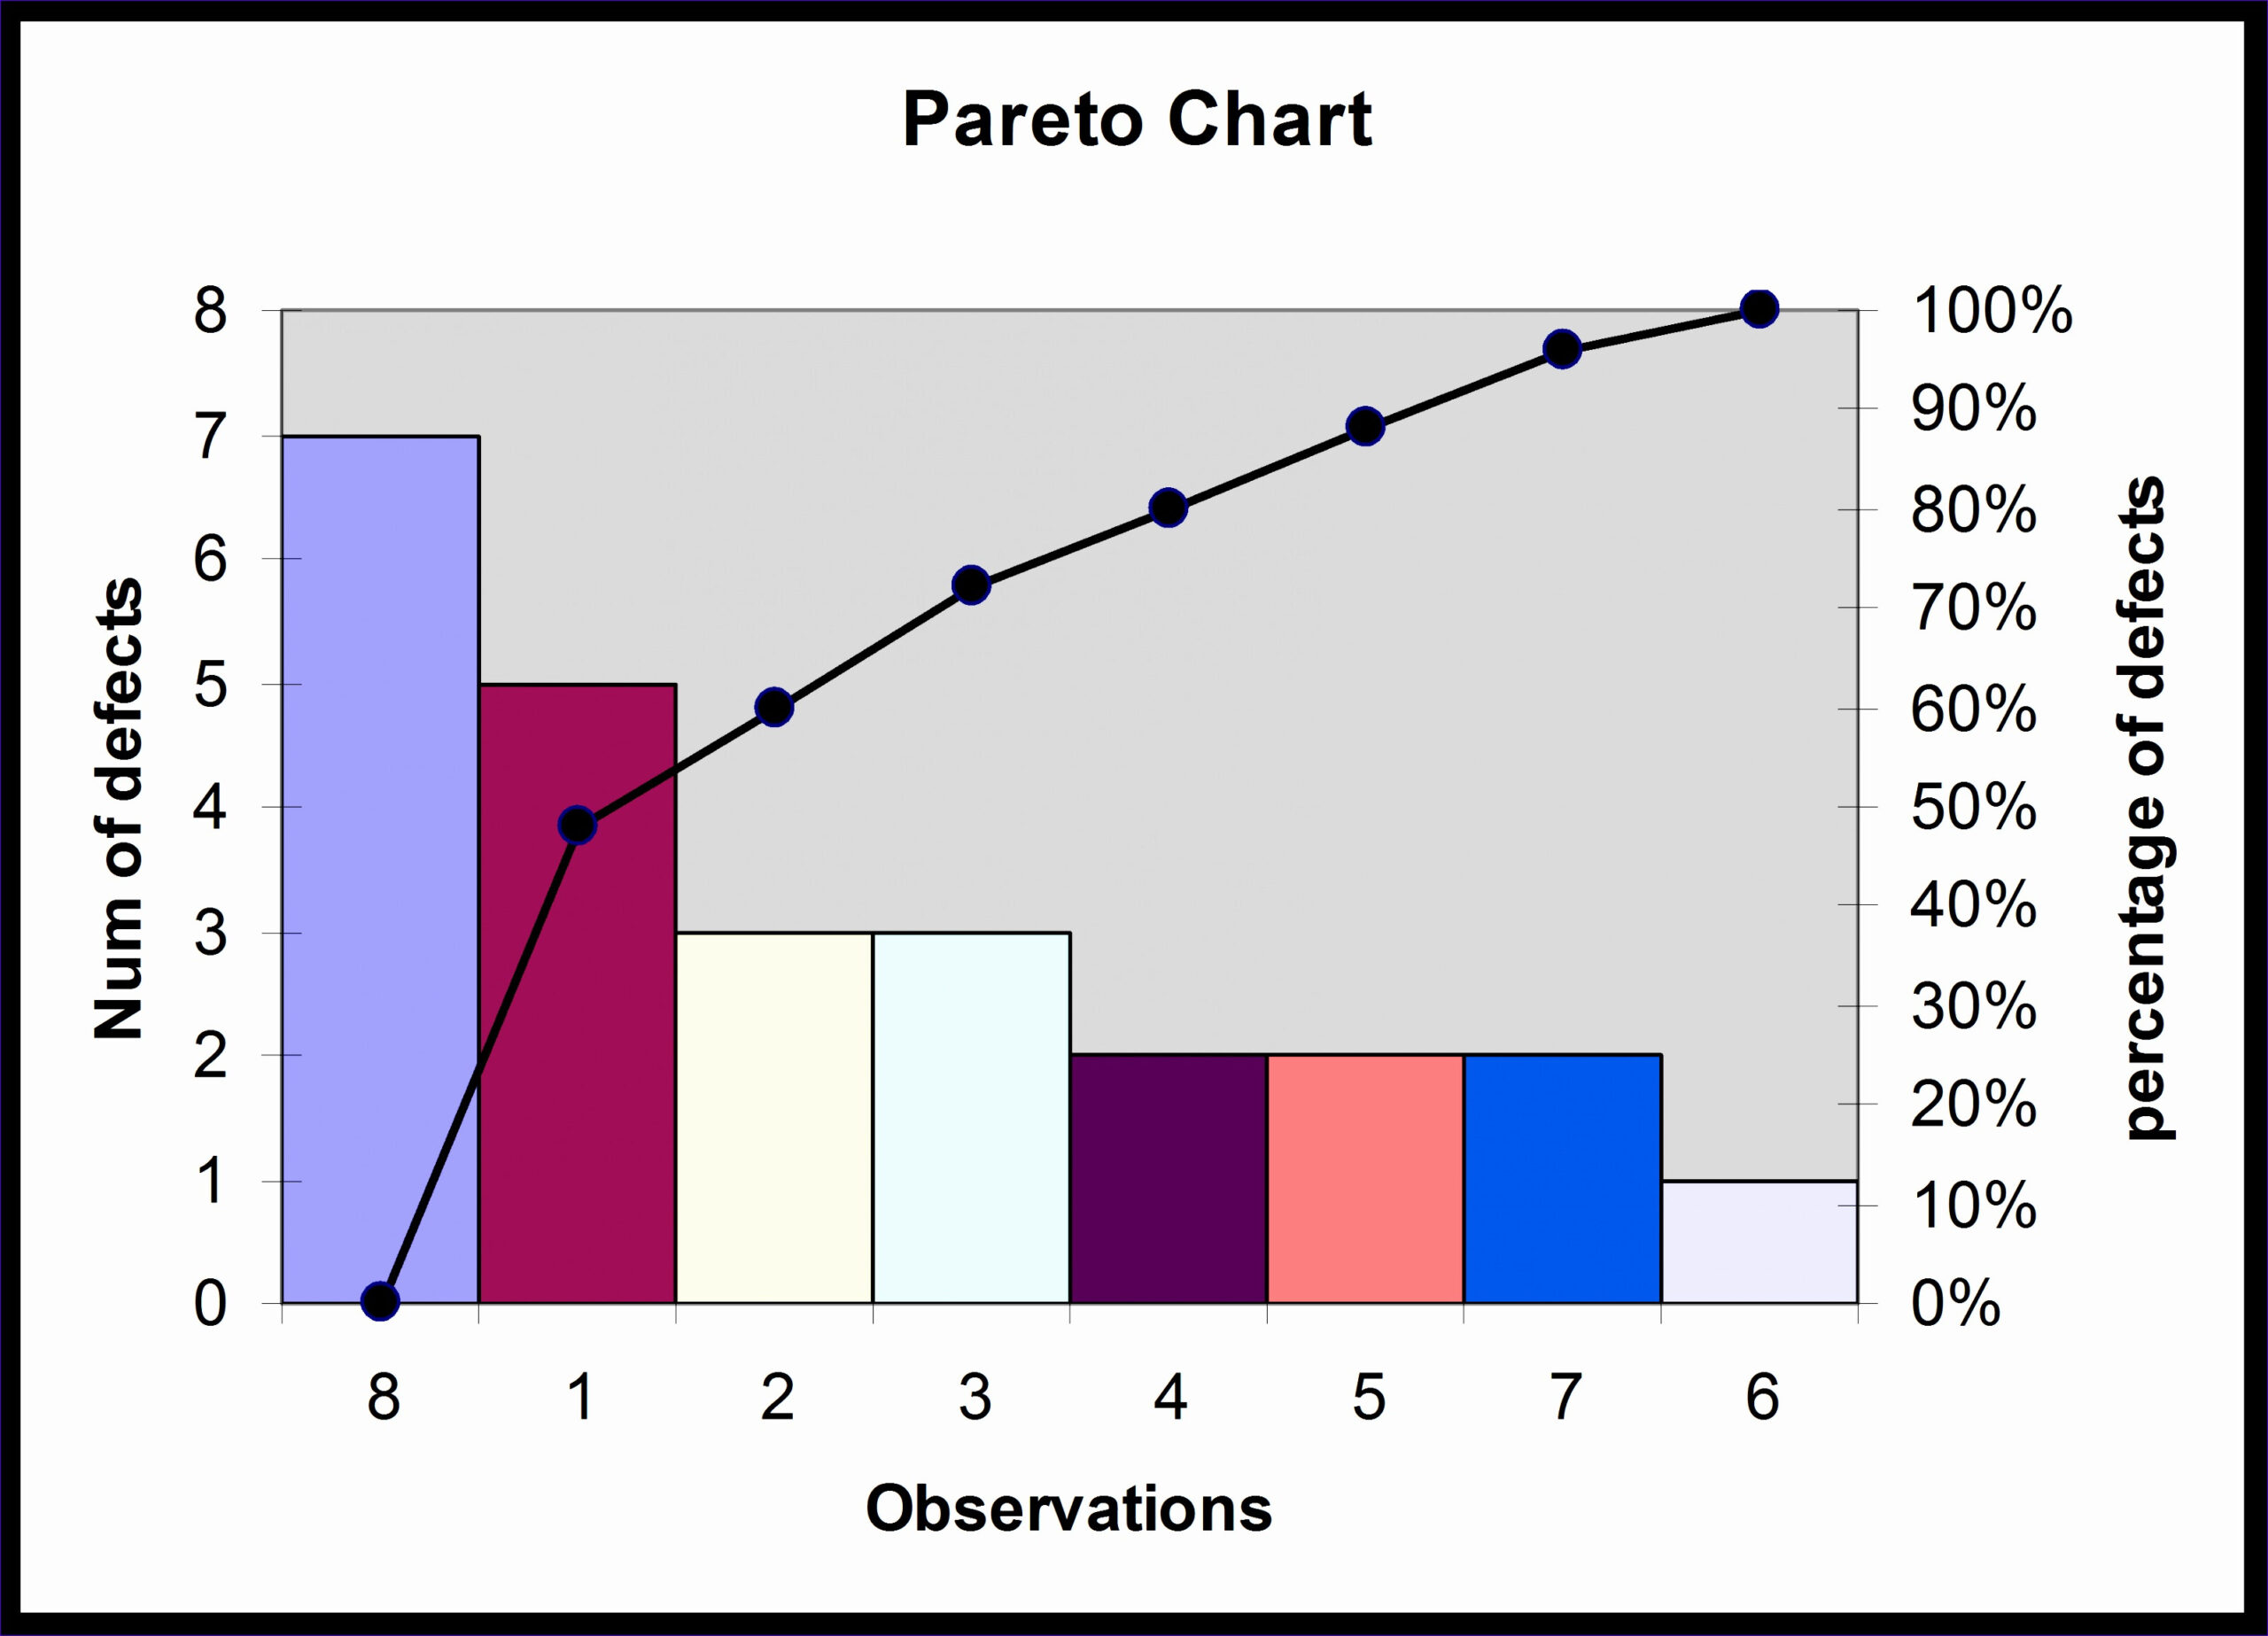
Based on the Pareto Principle (80/20 rule), this bar chart identifies the most significant factors contributing to a problem. Prioritizes the most significant factors contributing to a problem by focusing on the vital few from the trivial many.

CONTROL CHARTS
Used to monitor the stability of a process over time by plotting data points and establishing control limits. Control Charts monitor process performance over time, highlighting variations that are due to common causes (inherent to the process) or special causes (external factors).
DESIGN OF EXPERIMENTS (DOE)
A structured approach to determine the relationship between factors affecting a process and the output of that process. By applying factorial designs, response surface methods, and other DOE techniques, businesses can uncover optimal process settings, leading to improved quality, reduced costs, and enhanced efficiency.
HYPOTHESIS TESTING
Involves making statistical inferences about population parameters based on sample data. P-values play a crucial role in hypothesis testing by quantifying the strength of evidence against the null hypothesis, helping analysts determine whether observed results are statistically significant.
What is the best statistical analysis tool?
Minitab is often praised for its user-friendly interface, extensive range of statistical analyses, and robust capabilities in data visualization and quality improvement.
TAKEAWAYS
Six Sigma’s integration of data analysis and statistical tools provides a robust framework for continuous improvement. By leveraging tools like control charts, regression analysis, and process capability analysis, organizations can achieve significant quality enhancements, reduce variability, and drive sustainable success.