WHAT ARE CONTROL CHARTS?
Control Charts, also known as Shewhart charts or process-behavior charts, are a statistical tool used to monitor and control a process over time. They help determine whether a process is in a state of statistical control and identify any variations that may indicate potential problems.
KEY CONTROL CHART CONCEPTS
Types of Variation
Common Cause Variation: Natural or inherent variability in a process that is stable over time. It is due to the random fluctuations in the process.
Special Cause Variation: Variation that is due to specific, identifiable sources. These variations are not inherent to the process and indicate that the process is out of control.
Components of Control Charts
Center Line (CL): Represents the average or mean value of the process data.
Upper Control Limit (UCL): upper threshold, usually set at +3 standard deviations from the center line.
Lower Control Limit (LCL): lower threshold, usually set at -3 standard deviations from the center line.
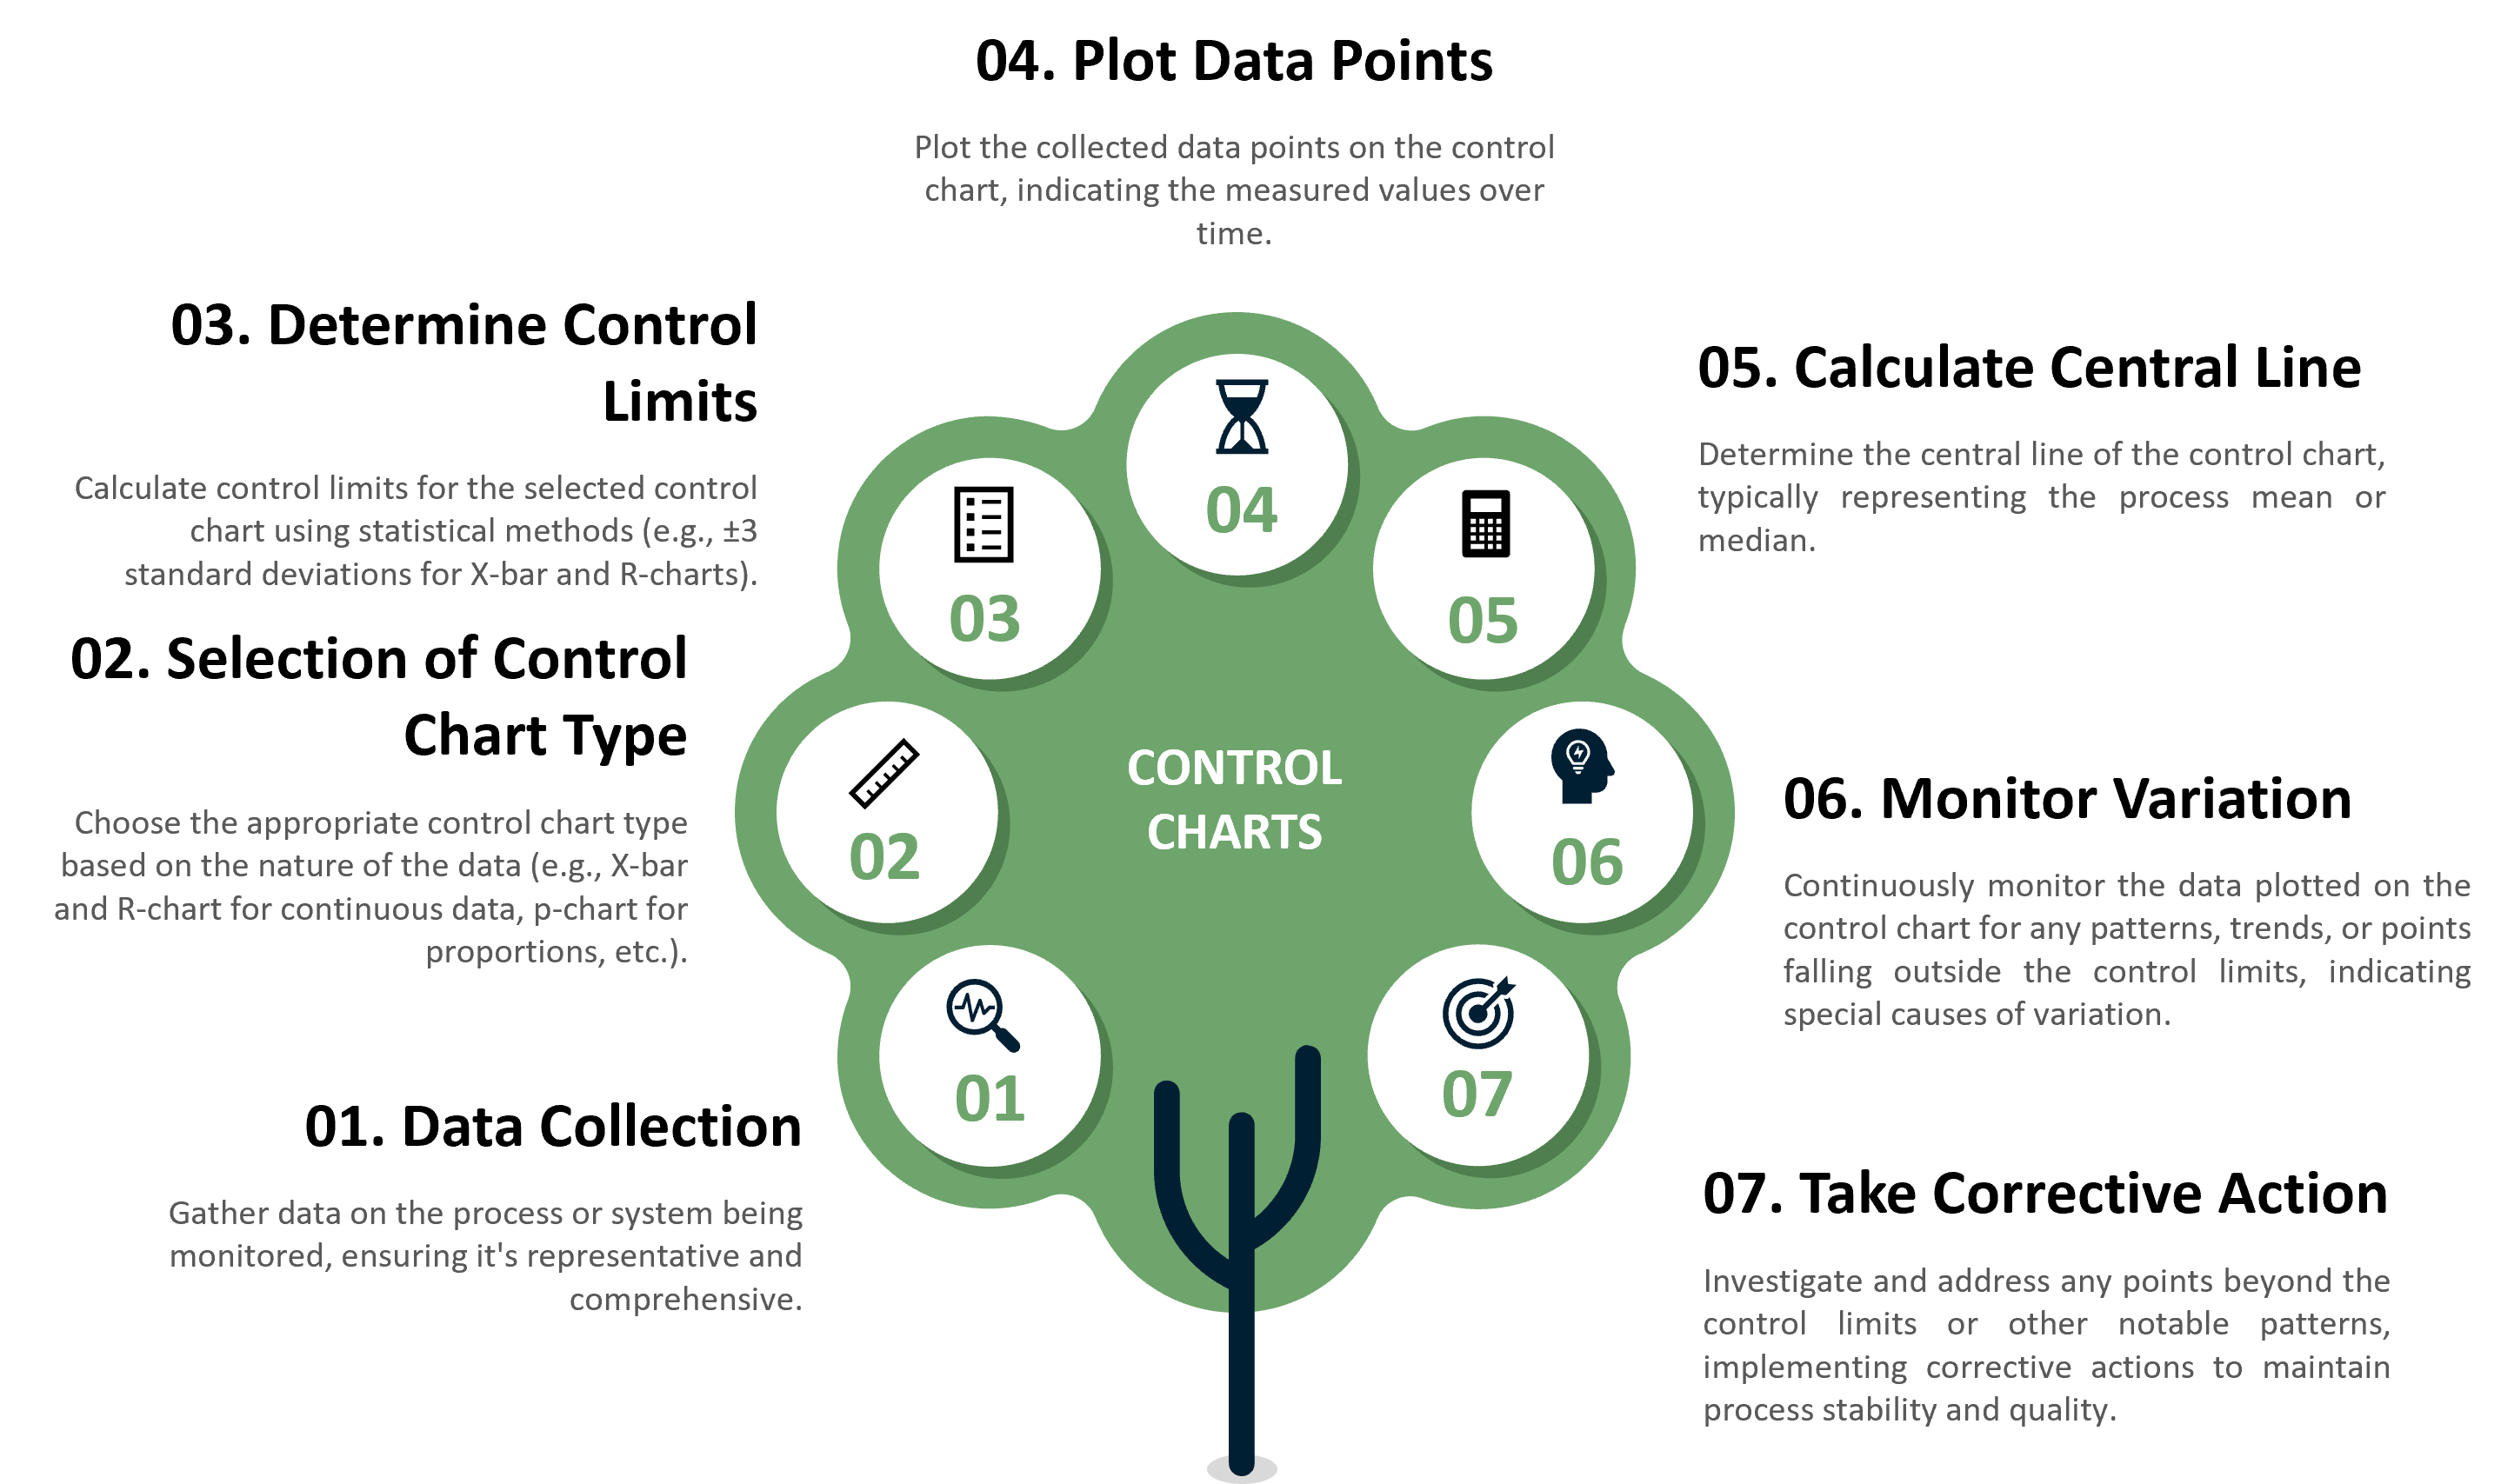
Steps in Creating Control Charts

TYPES OF CONTROL CHARTS
X-Bar and R Charts
Used for monitoring the mean and range of a process.
X-Bar chart tracks the changes in the process mean over time.
R chart tracks the changes in the process variability over time.
X-Bar and S Charts
Similar to X-Bar and R charts but used when sample sizes are larger. S chart tracks the standard deviation of the process.
Individual (I) and Moving Range (MR) Charts
Used when data is collected one at a time. I chart monitors individual data points, and MR chart monitors the range of successive data points.
P Charts and NP Charts
Used for monitoring the proportion of defective items in a process.
Suitable for attribute data (pass/fail, yes/no).
NP Charts: similar to P charts but used for monitoring the number of defective items in a fixed sample size.
C Charts
Used for monitoring the number of defects per unit in a process.
Suitable for count data where the number of occurrences is counted.
U Charts
Similar to C charts but used when the sample size varies. Monitors the number of defects per unit over varying sample sizes.
MPORTANCE OF CONTROL CHARTS
Process Monitoring: Helps in continuously monitoring process performance over time.
Quality Improvement: Identifies variations that may indicate problems, allowing for timely corrective actions.
Decision Making: Provides a visual representation of process stability and variability, aiding in better decision making.
Cost Reduction: Helps in identifying inefficiencies and reducing waste by maintaining process control.
APPLICATIONS OF CONTROL CHARTS
Manufacturing: To monitor production processes and ensure product quality.
Healthcare: To monitor patient care processes and improve healthcare delivery.
Service Industry: To track performance and improve service quality.
Supply Chain Management: To monitor and control supply chain processes.
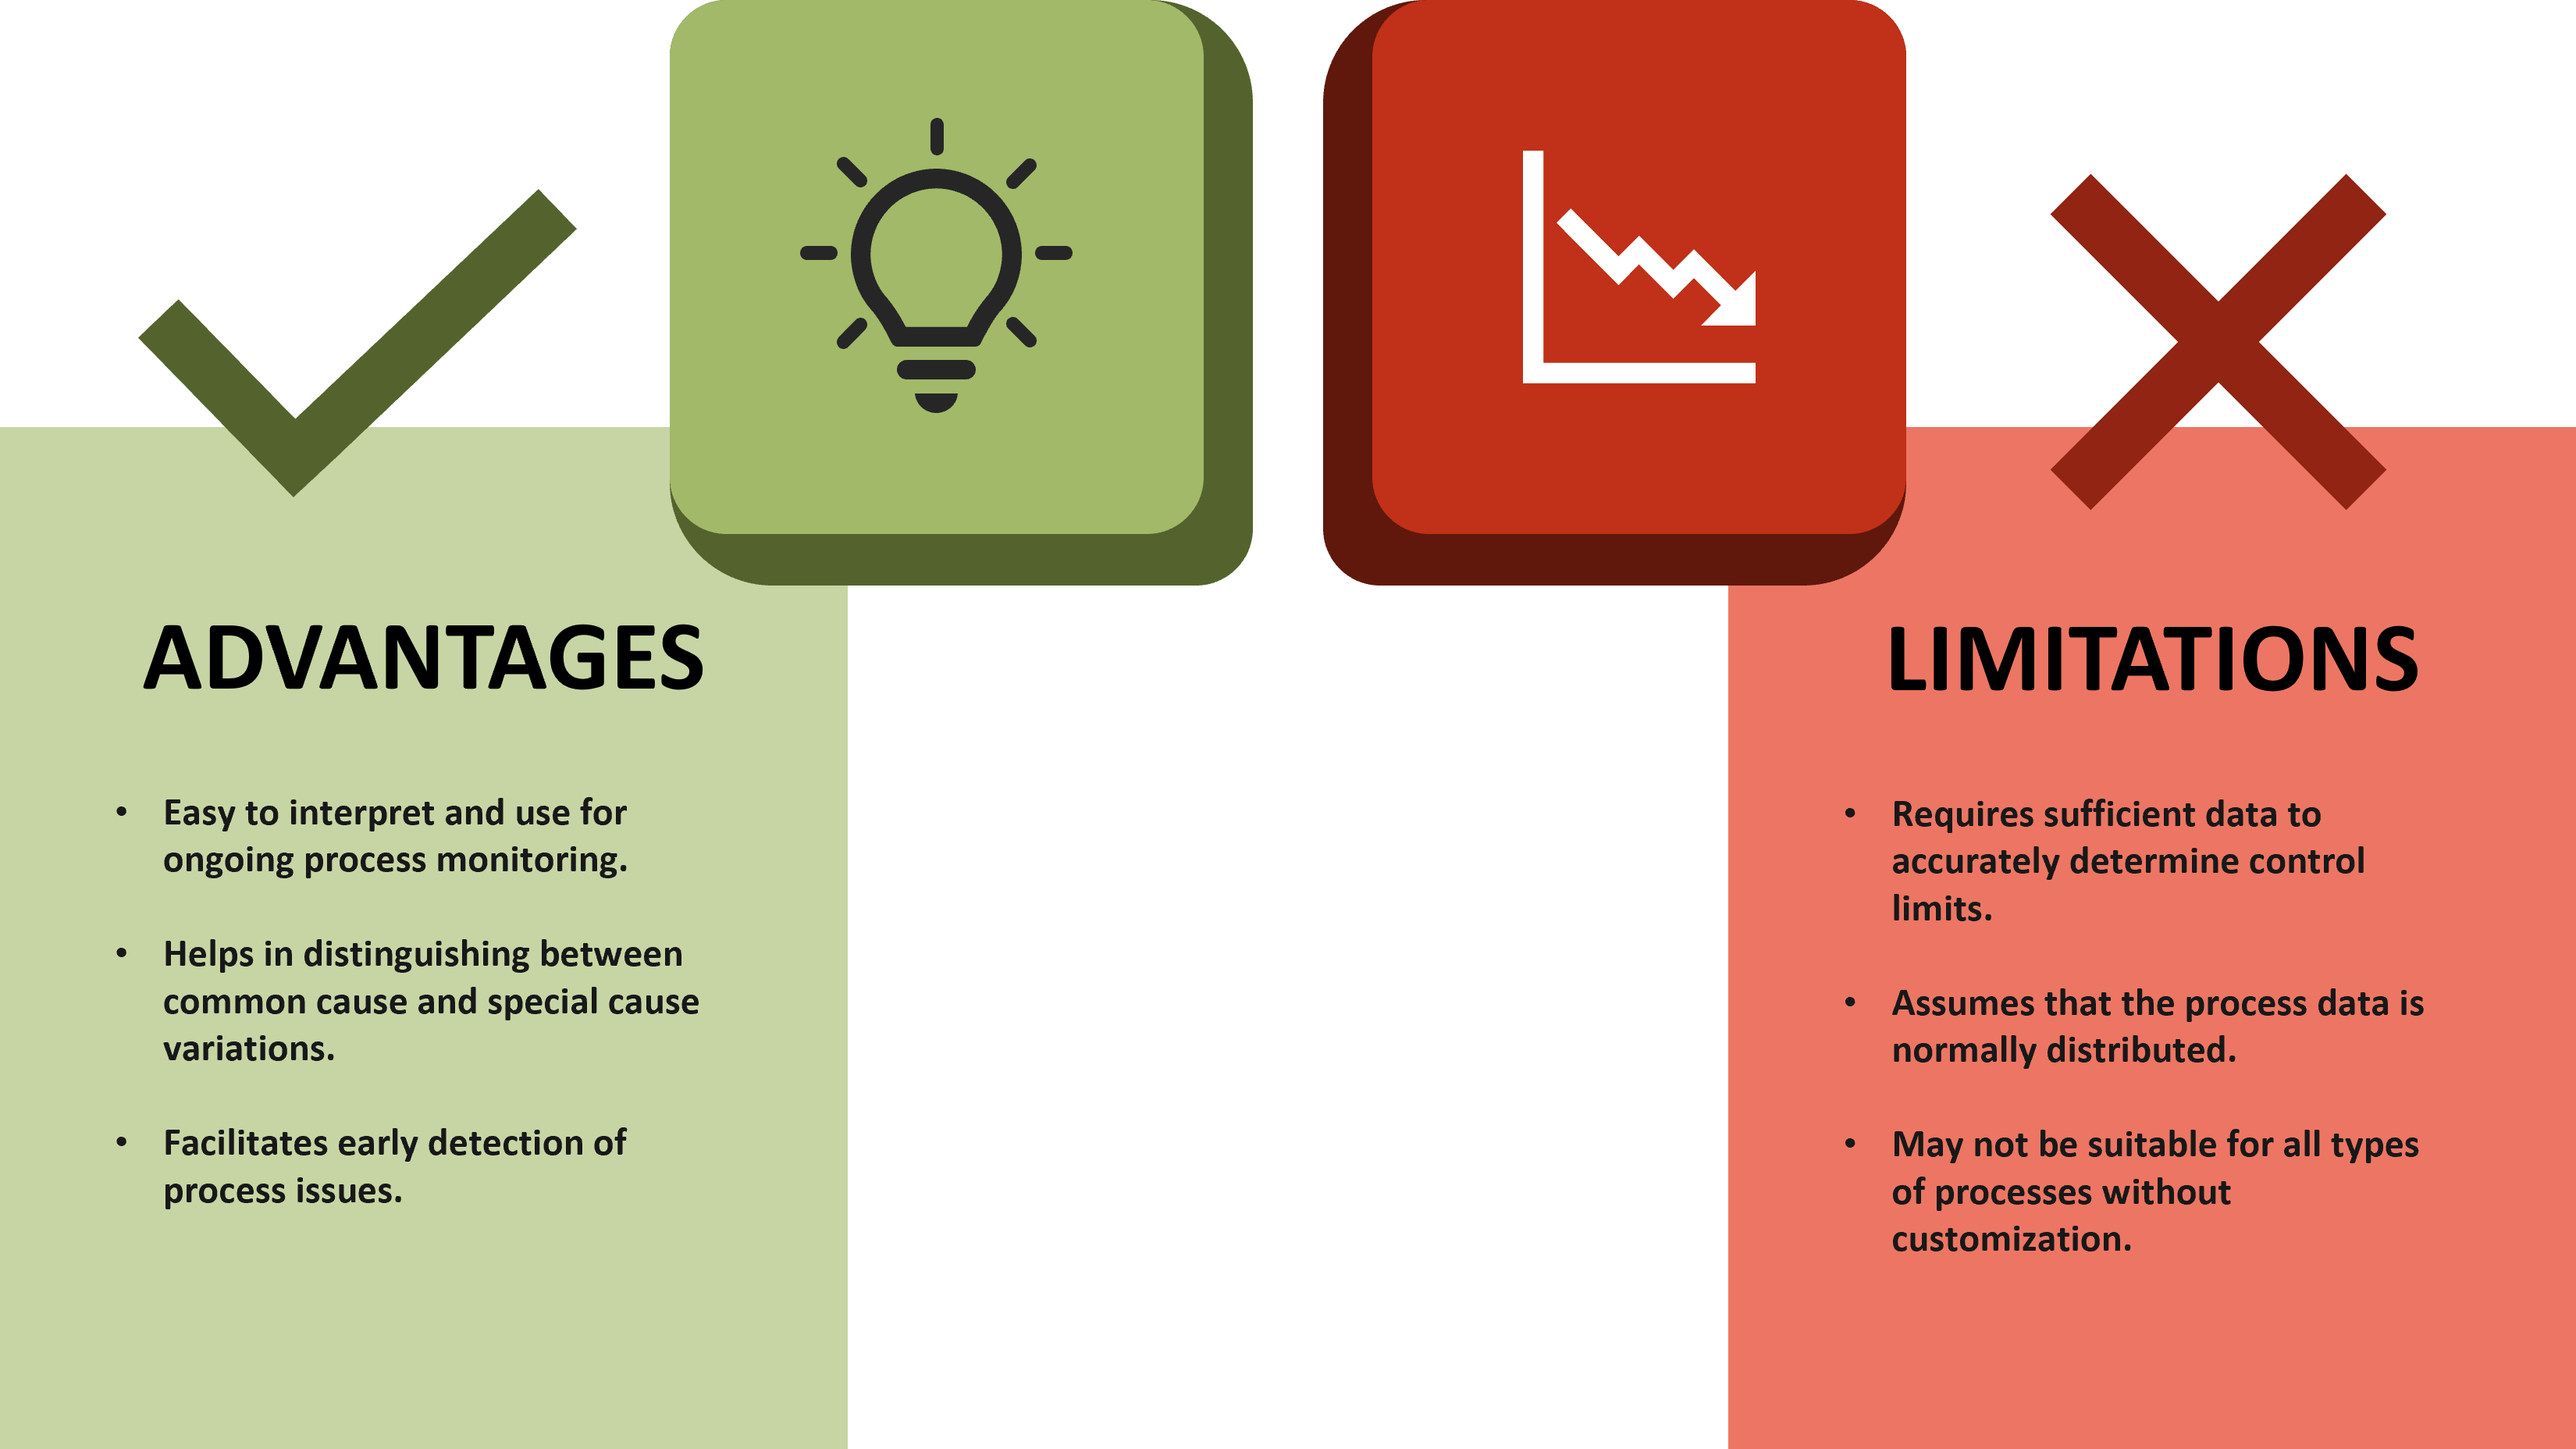
ADVANTAGE vs LIMITATION
