WHAT ARE DESCRIPTIVE STATISTICS?
Descriptive statistics serve as the foundational tools for understanding and summarizing datasets. They provide quantitative summaries of the central tendency, dispersion, and shape of data. Here’s a breakdown of the key concepts:
KEY DESCRIPTIVE STATISTICS CONCEPTS
Measures of Central Tendency
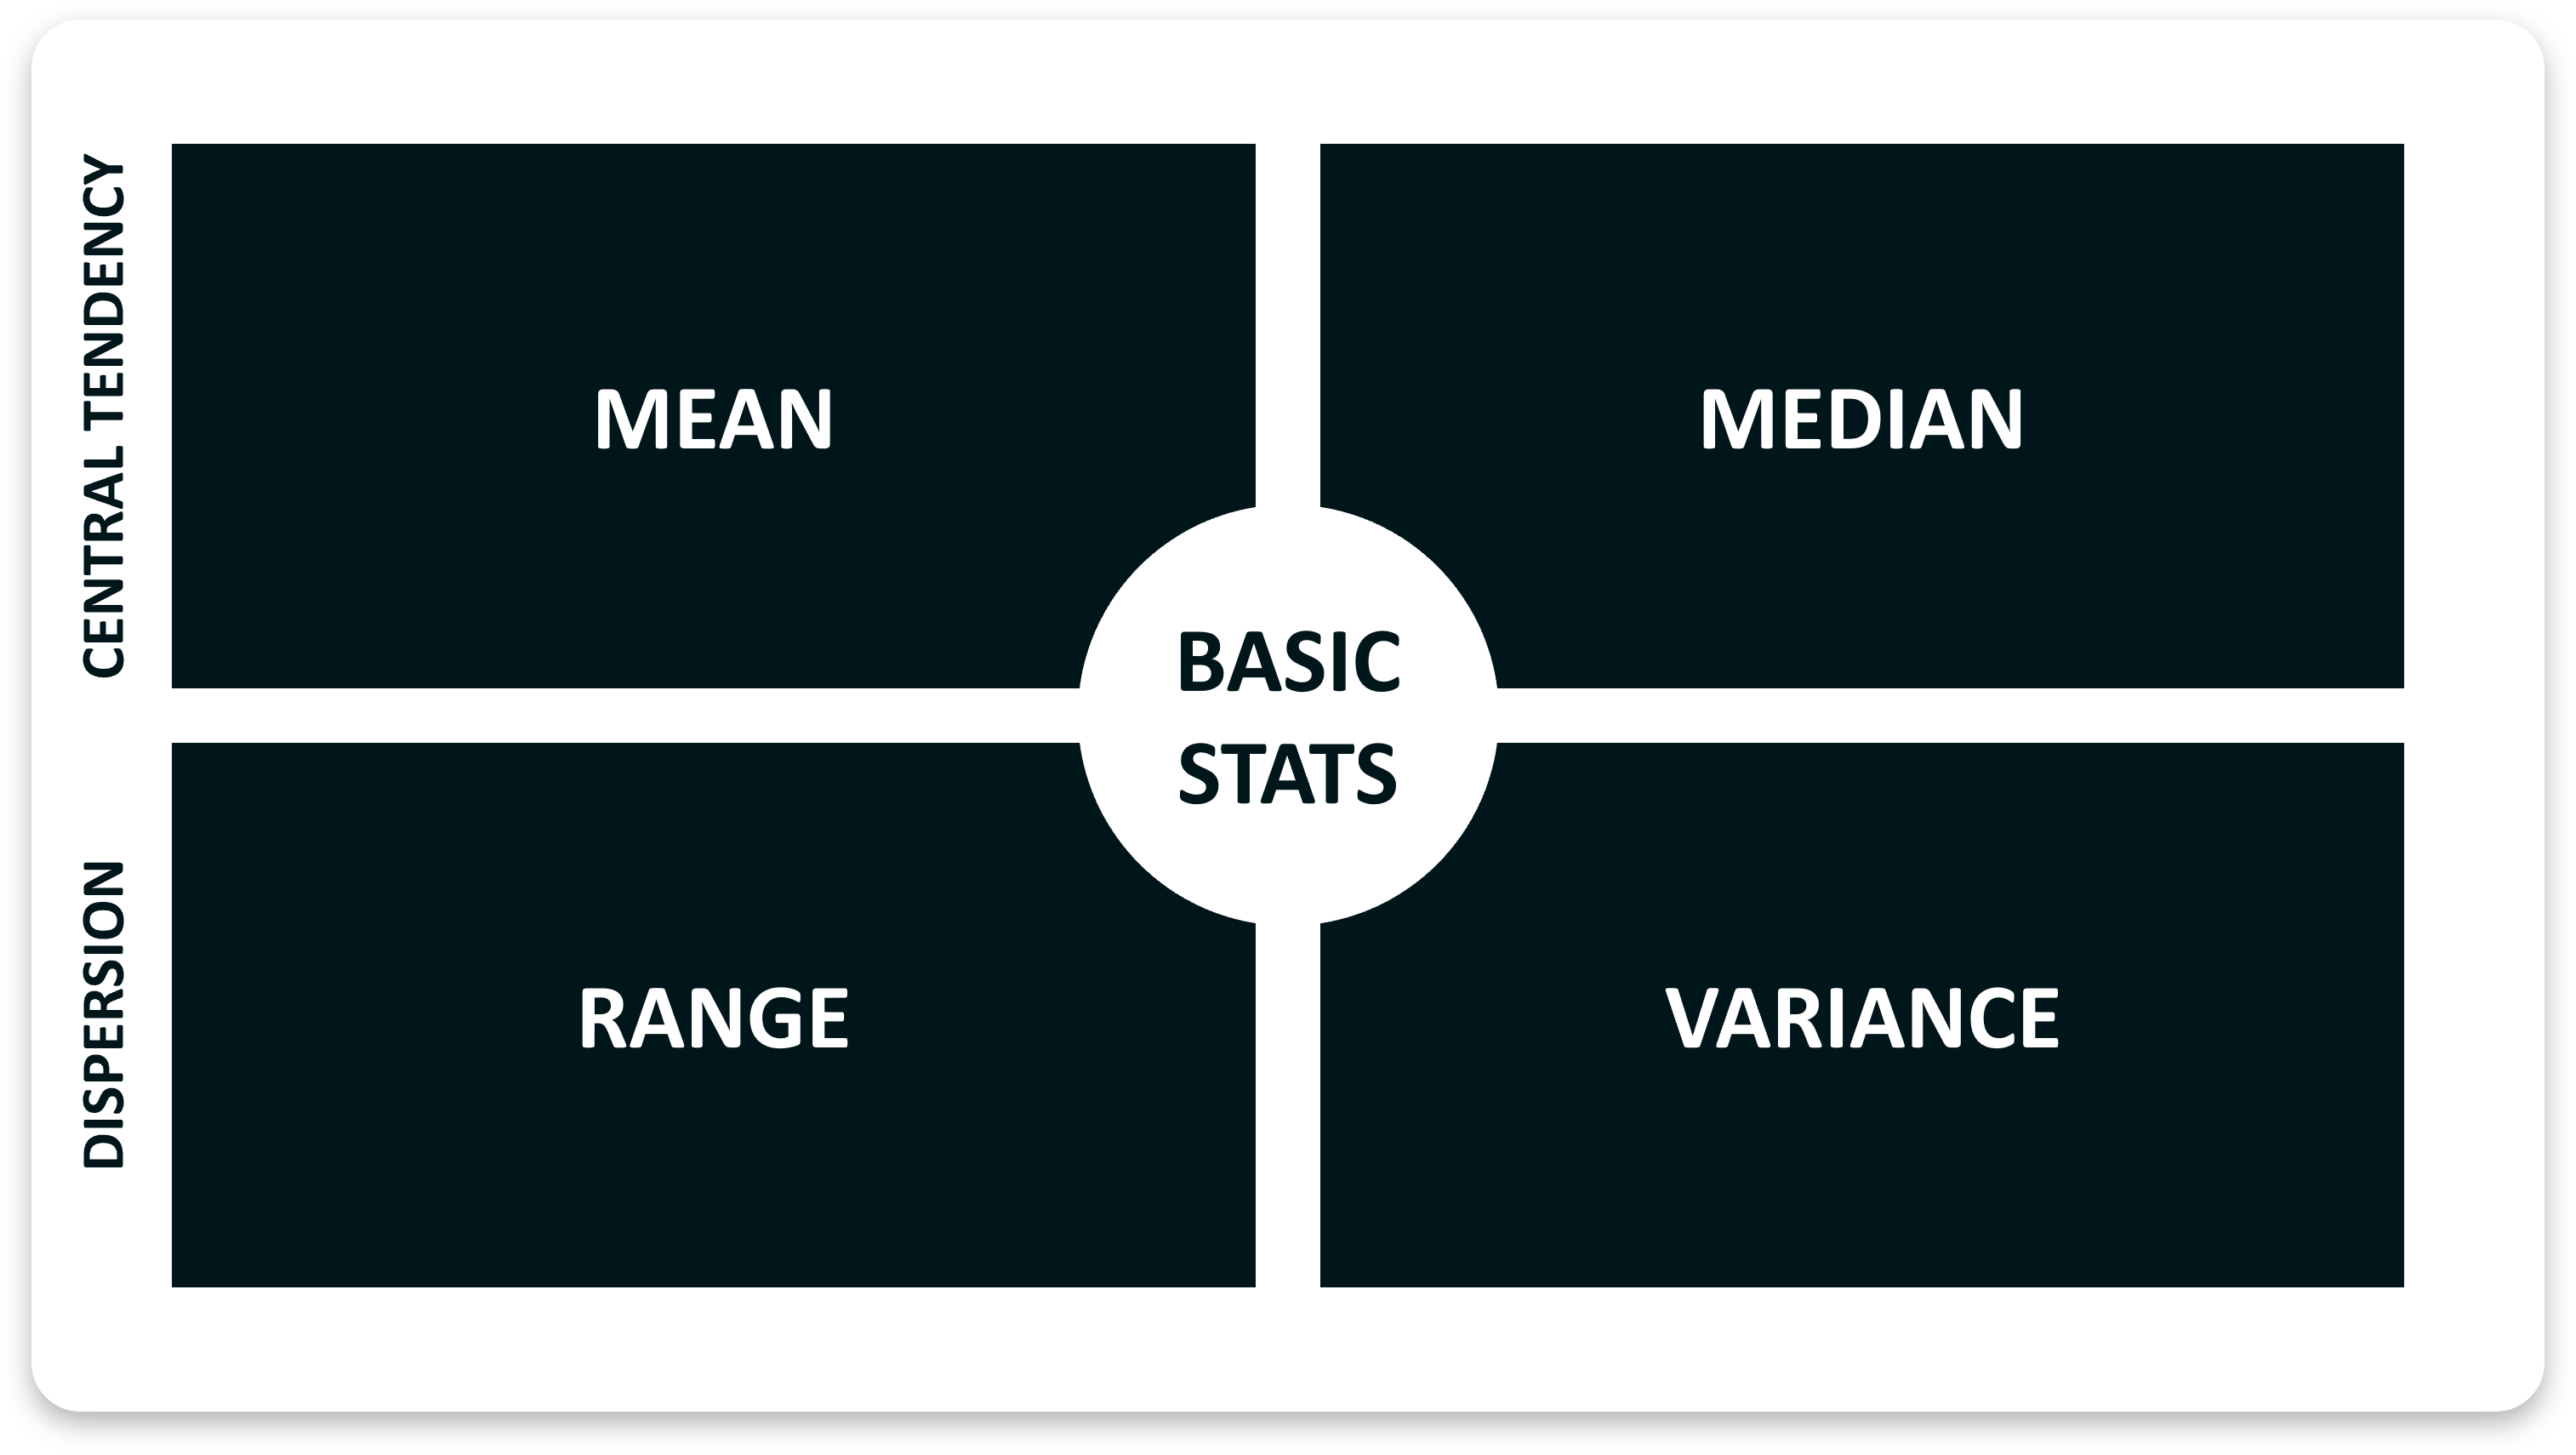
Mean (μ): Calculated as the sum of all values in a dataset divided by the number of values. It’s sensitive to outliers.
Median: The middle value of a dataset when arranged in ascending or descending order. It’s robust to outliers.
Mode: The value that occurs most frequently in a dataset. A dataset can have one mode (unimodal), two modes (bimodal), or more.
Measures of Dispersion
Range: The difference between the maximum and minimum values in a dataset. It’s sensitive to outliers.
Variance (σ²): The average of the squared differences from the mean. It provides a measure of how much the data values deviate from the mean.
Standard Deviation (σ): The square root of the variance. It indicates the average deviation of data points from the mean.
Measures of Distribution
Frequency Distribution: A table that shows the number of occurrences of each value or range of values in a dataset.
Histogram: A graphical representation of the frequency distribution. It consists of contiguous bars that represent the frequency of values falling within specific intervals (bins).
Probability Distribution: Describes the likelihood of obtaining each possible value of a random variable. Common probability distributions include normal distribution, binomial distribution, and Poisson distribution.
Shape Parameters
Skewness: Measures the asymmetry of the distribution. Positive skewness indicates a longer tail on the right side, while negative skewness indicates a longer tail on the left side.
Kurtosis: Measures the “tailedness” of the distribution. High kurtosis indicates a distribution with heavy tails, while low kurtosis indicates a distribution with light tails.
Percentiles and Quartiles
Percentiles: Divide a dataset into 100 equal parts. For example, the 25th percentile (Q1) represents the value below which 25% of the data falls.
Quartiles: Divide a dataset into four equal parts. The first quartile (Q1) is equivalent to the 25th percentile, the second quartile (Q2) is equivalent to the median, and the third quartile (Q3) is equivalent to the 75th percentile.
Tiles of Descriptive Statistics
